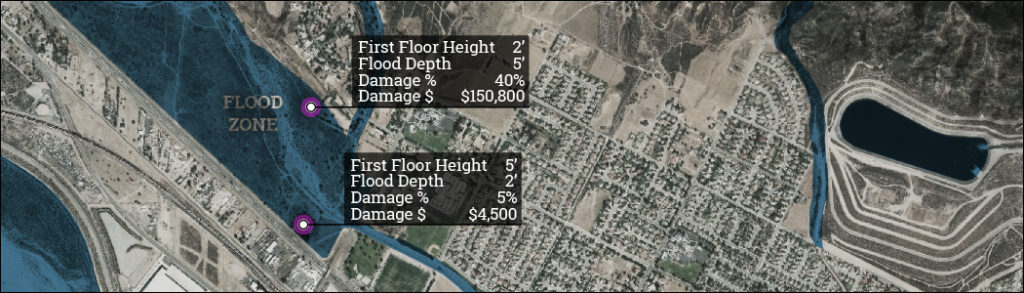
RAMP USER GUIDE

The Risk Assessment Mapping Platform (RAMP) allows interactive discovery of risk, vulnerability, and exposure data developed for each Hazard Mitigation plan. RAMP portrays exposure and (in most projects) damage assessments to natural hazards in a spatial context. RAMP has 4 views including population exposure, parcel (property) exposure, infrastructure exposure, and damage estimations (property & assets).

RAMP displays data overlaid with natural hazards with interactivity allowing individual discovery of exposure summaries in order to answer questions like:

How many people are exposed to the 100-Year Flood in a given city?

What type of property value is exposed to the Very High wildfire threat?

Explore the specific guides below:

RAMP Anatomy

RAMP Anatomy

The basic anatomy of the RAMP application is shown below. The main components are the map selector, data summary controls, the map window, and the legend/layer control.

Map Selector

Changes the current interactive map to the theme chosen.

Data Summary Controls

Data filtering tools toggles that subset the data shown on the map and provide aggregate summaries of the data theme. Filtering is enabled by jurisdiction and hazard level.

How many people in ____ city are in the 100 yr flood?

Note: the extent of the map frame will ALWAYS filter the data summary!

Map Window

Displays the current map data corresponding to the layer control and the filters applied in the data summary controls.

Legend / Layer Control

Displays the symbology key for given map layers and allows the user to toggle on/off thematic and hazard layers.

Where is the floodplain? The high wildfire danger?

Mapping Themes

Various map themes are available in RAMP in the main navigation on the top right:

Clicking any of these will launch the corresponding map view or help (this user guide).

Mapping Themes

Exposure Summary

Summary counts or values are provided in the Data Summary Controls Area for each map set. These widgets are interactive and allow the user to filter the data on the map and the thematic data summary in a variety of ways to explore hazard exposure in a customizable and detailed manner. The data summaries are dynamic to reflect user-defined filtering widgets and the data visible within the map window. The figure below reflects the general definition of exposure – a point is exposed if it falls within the natural hazard’s spatial footprint.

Population – Exposure by Hazards

Census ACS 2015 population estimates intersected with hazard overlays into sub-divided proportional population-by-hazard areas. Populations for these areas were calculated using the proportional area of each census block group within the hazard area as shown in the illustration below.

Parcels – Exposure by Hazard

This data is created using parcel geometry and assessor roll datasets. Centroids are created from parcel geometry for parcels that had residential improvements and valid associated building values. If multiple buildings are present for a given parcel as represented by assessor data, the value for the centroid was reduced proportionally by the number of points in the parcel.

Infrastructure – Exposure by Hazard

Includes point and linear features in various critical infrastructure categories created from sources including the local jurisdiction, California CDSS, FEMA, Cal Fire, USACE, CEC, and CGS.

Damage Assessments

Damage assessments are performed on residential parcels and the jurisdiction’s insurance schedule – note this may not correspond directly with other critical infrastructure data due to the input requirements of the damage estimation software.

Map Layers

To toggle map layer visibility on/off click the toggle for the thematic or hazard layers in the right side of the map as demonstrated below. Click the +/- button to zoom in/out on the map. The mouse wheel can also control the zoom level of the map. The home button will return the map to the full extent of the study area.

Data Summaries

To control the data summary, the toggles and widgets in the Data Summary Controls area can be switched on/off. In the example below the toggles under “Vulnerability Data” will filter the “Selected Population” summary. When the user clicks “FEMA Flood Risk” the points on the map are filtered and the data summary reflects the population exposed to the FEMA Flood Zone data (toggling the corresponding map layer is also demonstrated in the animation below to give context to the data summary filter). Where available activating a toggle will also enable subcategory filters to further refine the data filter – those subcategories that are checked are active. The user can add to the filtering by choosing an area of interest from the Jurisdiction widget, or additional hazard filters, and by changing the extent of the map – the map window will always filter the data summary.

The Active Filters flyout window shows the user which filters are applied. All filters can be removed by clicking the “Clear All Filters” button.

Translate »